After a sharp bounce from $98,385 to $107,000, Bitcoin is consolidating tightly. Is this merely the calm before the next crypto explosion—or a fakeout that could trap bulls? In this post, we’ll break down the technical setup, institutional trends, altcoin movements, and what on-chain data says about where the market is headed next. With indicators flashing mixed signals, this could be a decisive moment not just for Bitcoin but for the entire crypto market.
Bitcoin’s recent price rebound from $98K to $107K has captured attention across the crypto world. What’s more important than the price bounce, however, is the structure it’s forming.
Key Observations:
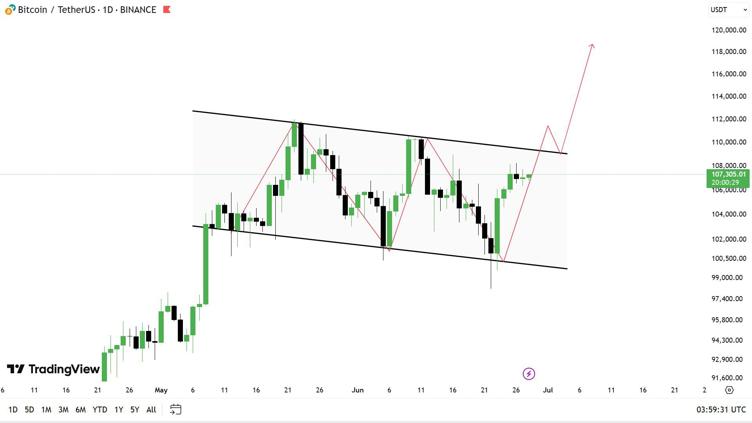
Trading range: $106K–$107K
Strong support: $104K–$105K
Resistance ahead: $108.6K–$109K
Potential breakout target: $115K
BTC is forming a bullish flag—a continuation pattern that historically leads to further upside when confirmed.
BTC$BTC Bitcoin Rebounds to $107K – Calm Before the Next Explosion?
Technical Indicators Flash Mixed Signals: Break or Fake?
H3: MACD, RSI, and Bollinger Bands Analysis
MACD: Gaining positive momentum
RSI: Neutral-bullish (~58), room to climb
Bollinger Bands: Tightening = imminent volatility
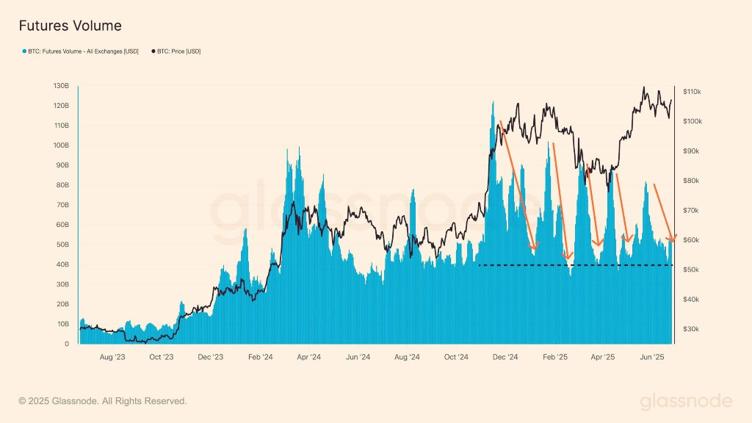
📊 Technicals hint at a potential breakout, but over-leveraged longs are a warning sign.
Read our in-depth guide to using RSI in crypto trading
Institutional Activity – Are the Big Players Still Buying?
BlackRock and other institutions continue to accumulate BTC, indicating long-term bullish sentiment.
BNB, SOL, and LINK are breaking out of accumulation
Check out our guide to identifying Altcoin Season signals
BTC$BTC Bitcoin Rebounds to $107K – Calm Before the Next Explosion?
Risk Management – Don’t Chase Green Candles
Smart Strategy Beats FOMO
Don’t enter just because of a breakout
Watch for confirmation above $109K
Use tight stop-losses below $104K
Scale in rather than going all-in
📌 “Be greedy when others are fearful, and fearful when others are greedy.” – Warren Buffett
FAQ Section
Q1: What does a bullish flag pattern mean for Bitcoin?
It’s a continuation pattern that often precedes a further move in the same direction, usually up if confirmed with volume.
Q2: Is the $107K breakout real or a fakeout?
Too early to tell. Confirmation above $109K with spot volume will validate it.
Q3: Why is the long/short ratio a warning sign?
A high ratio means too many longs. If price dips, it could trigger cascading liquidations.
Q4: How do institutional investors affect Bitcoin’s price?
Their accumulation often supports long-term price growth and adds credibility.
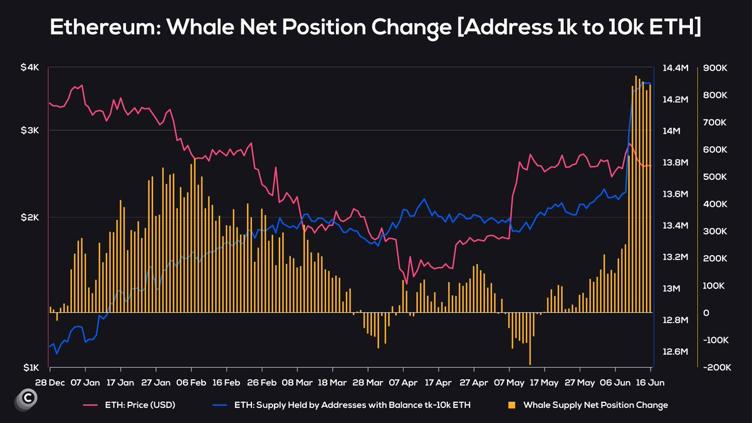
Q5: Is Altcoin Season starting?
Ethereum whale behavior and other leading indicators suggest it might be.
Q6: How should I trade this move?
Wait for confirmation, manage risk carefully, and avoid over-leveraging.
Conclusion: Calm Before the Breakout or Storm?
BTC$BTC is at a crossroads. With bullish technicals, rising institutional support, and altcoin momentum building, we might be witnessing the early stages of the next major rally. However, high leverage and regulatory uncertainty keep risk in play.
🧠 Trade smart, follow the signals, and stay informed.
📌 Don’t miss out! Subscribe to our newsletter for daily crypto updates and actionable market insights.
Leave A Comment