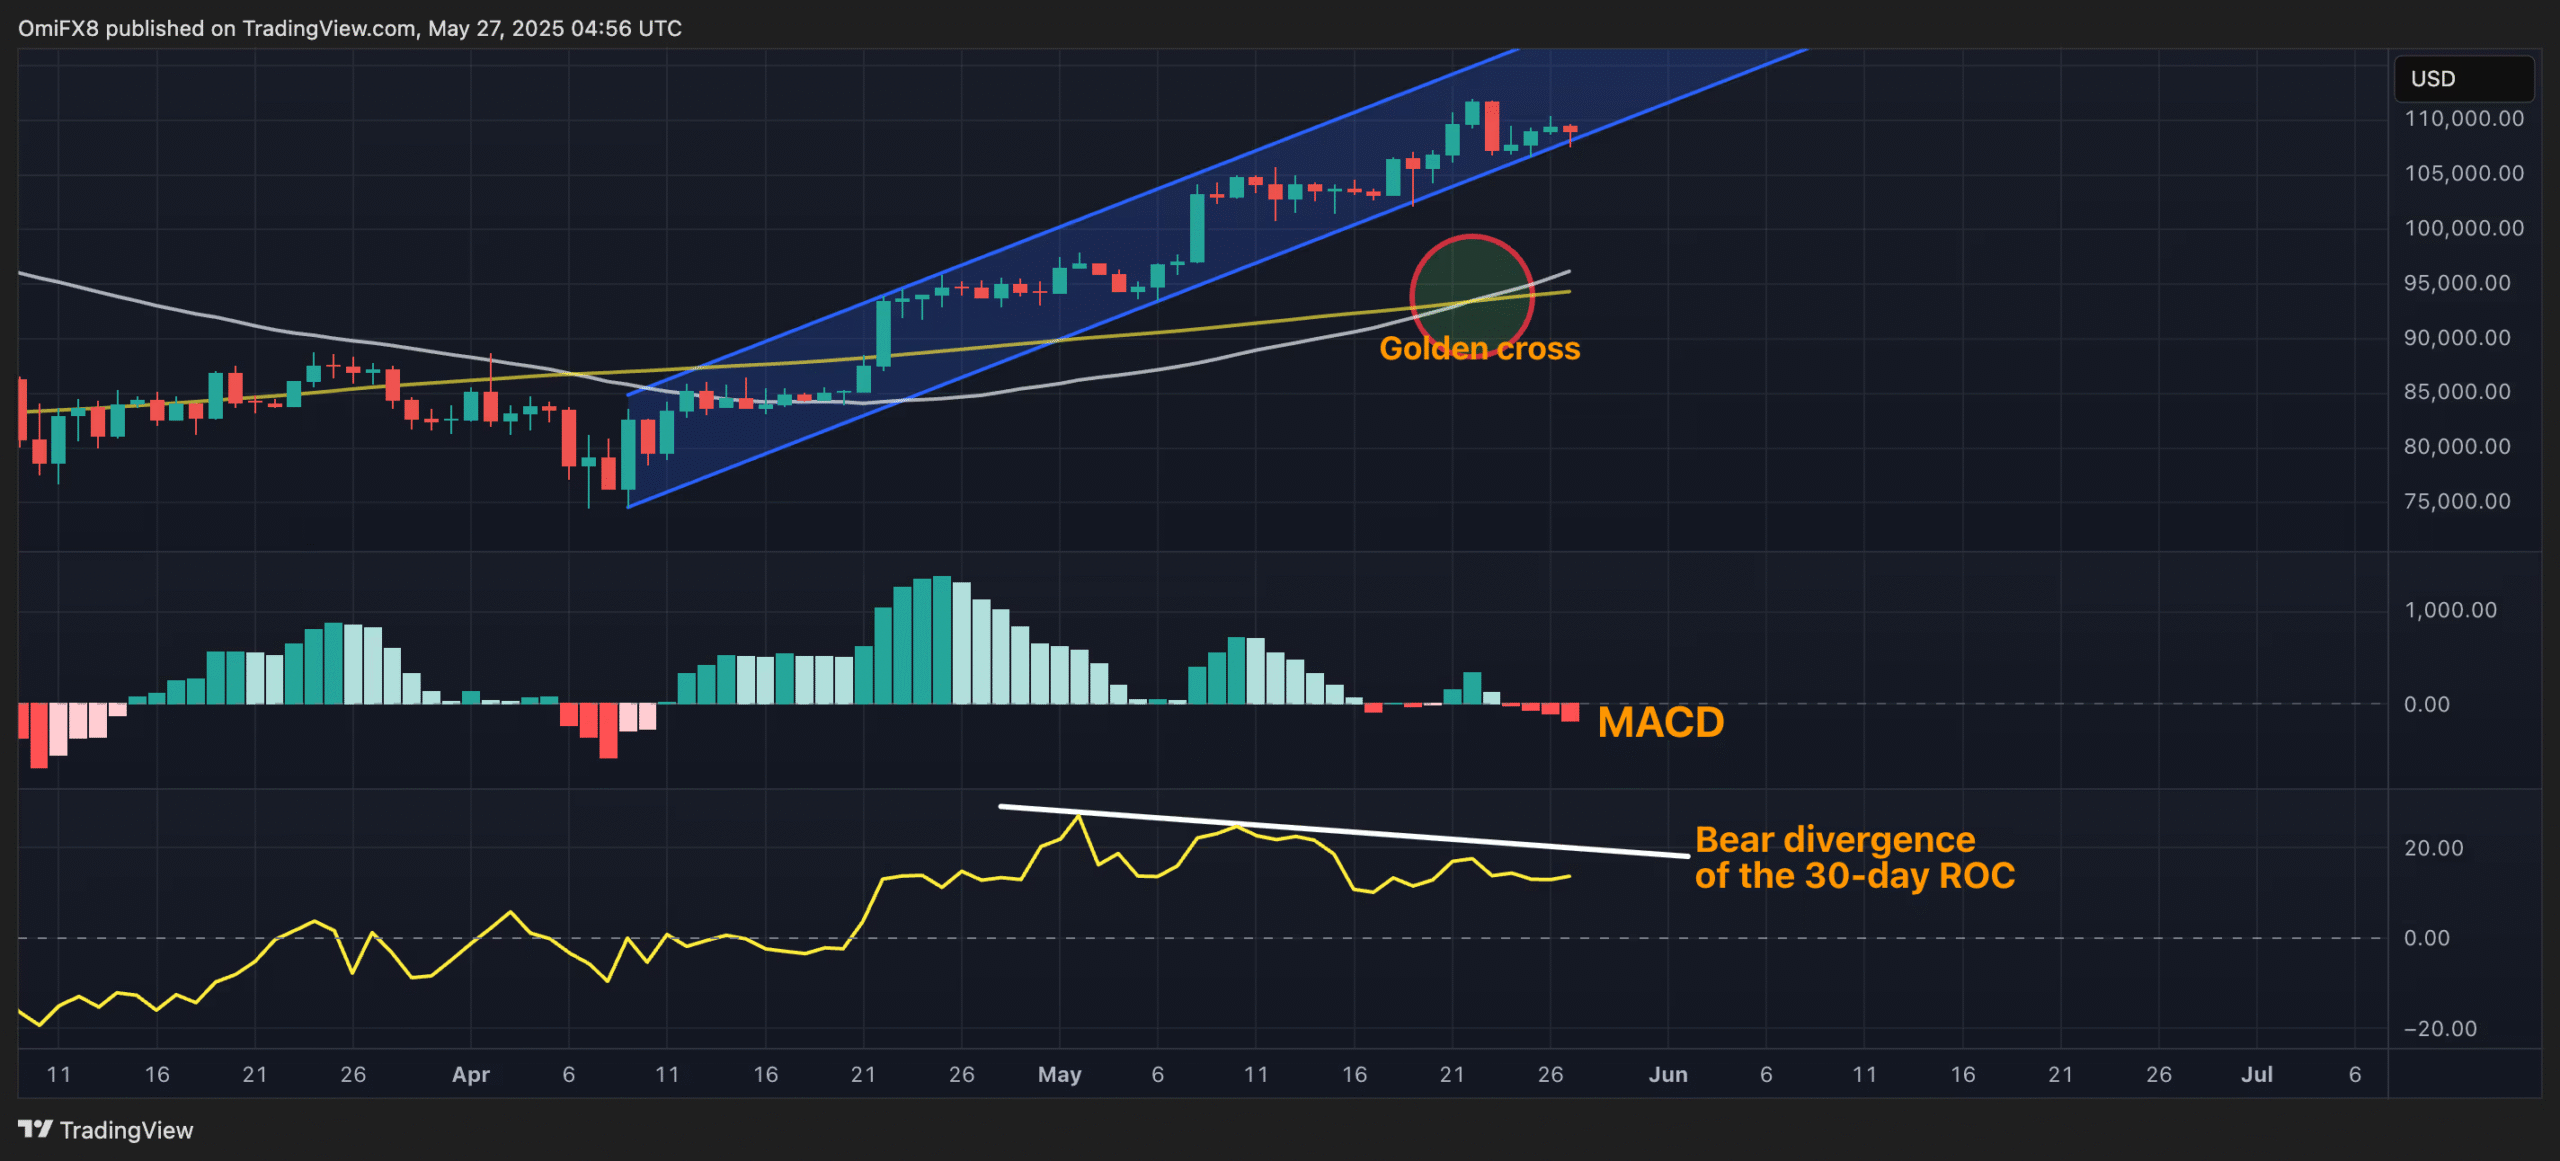
After a sharp bounce from $98,385 to $107,000, Bitcoin is consolidating tightly. Is this merely the calm before the next crypto explosion—or a fakeout that could trap bulls? In this post, we’ll break down the technical setup, institutional trends, altcoin movements, and what on-chain data says about where the market is headed next. With indicators flashing mixed signals, this could be a decisive moment not just for Bitcoin but for the entire crypto market.
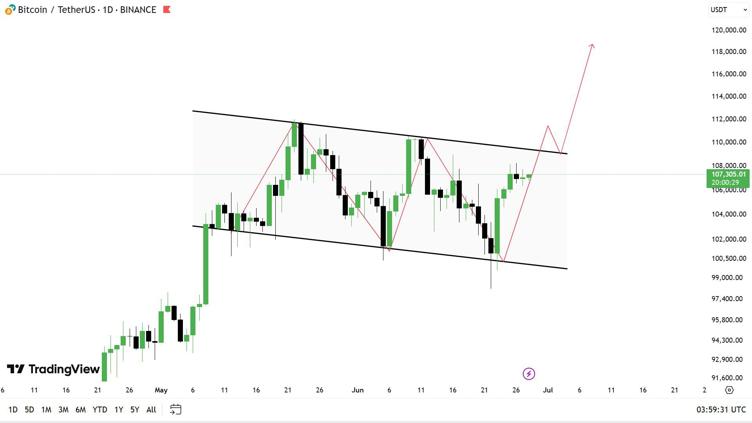
Bitcoin’s recent price rebound from $98K to $107K has captured attention across the crypto world. What’s more important than the price bounce, however, is the structure it’s forming.
Key Observations:
Trading range: $106K–$107K
Strong support: $104K–$105K
Resistance ahead: $108.6K–$109K
Potential breakout target: $115K
BTC is forming a bullish flag—a continuation pattern that historically leads to further upside when confirmed.
BTC$BTC Bitcoin Rebounds to $107K – Calm Before the Next Explosion?
Technical Indicators Flash Mixed Signals: Break or Fake?
H3: MACD, RSI, and Bollinger Bands Analysis
MACD: Gaining positive momentum
RSI: Neutral-bullish (~58), room to climb
Bollinger Bands: Tightening = imminent volatility
📊 Technicals hint at a potential breakout, but over-leveraged longs are a warning sign.
Read our in-depth guide to using RSI in crypto trading
Institutional Activity – Are the Big Players Still Buying?
BlackRock and other institutions continue to accumulate BTC, indicating long-term bullish sentiment.
BNB, SOL, and LINK are breaking out of accumulation
Check out our guide to identifying Altcoin Season signals
BTC$BTC Bitcoin Rebounds to $107K – Calm Before the Next Explosion?
Risk Management – Don’t Chase Green Candles
Smart Strategy Beats FOMO
Don’t enter just because of a breakout
Watch for confirmation above $109K
Use tight stop-losses below $104K
Scale in rather than going all-in
📌 “Be greedy when others are fearful, and fearful when others are greedy.” – Warren Buffett
FAQ Section
Q1: What does a bullish flag pattern mean for Bitcoin?
It’s a continuation pattern that often precedes a further move in the same direction, usually up if confirmed with volume.
Q2: Is the $107K breakout real or a fakeout?
Too early to tell. Confirmation above $109K with spot volume will validate it.
Q3: Why is the long/short ratio a warning sign?
A high ratio means too many longs. If price dips, it could trigger cascading liquidations.
Q4: How do institutional investors affect Bitcoin’s price?
Their accumulation often supports long-term price growth and adds credibility.
Q5: Is Altcoin Season starting?
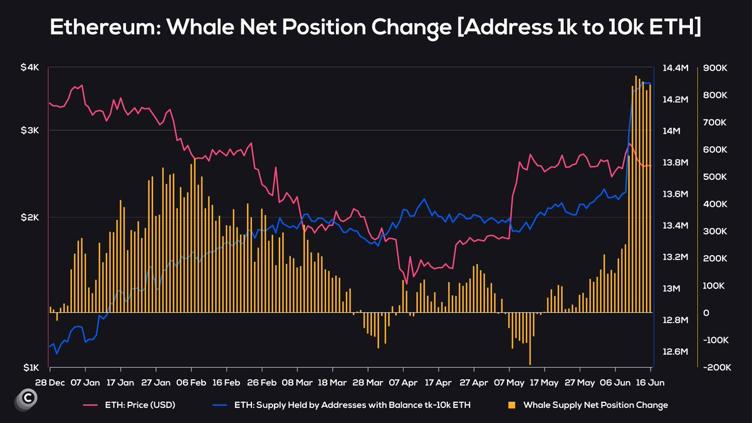
Ethereum whale behavior and other leading indicators suggest it might be.
Q6: How should I trade this move?
Wait for confirmation, manage risk carefully, and avoid over-leveraging.
Conclusion: Calm Before the Breakout or Storm?
BTC$BTC is at a crossroads. With bullish technicals, rising institutional support, and altcoin momentum building, we might be witnessing the early stages of the next major rally. However, high leverage and regulatory uncertainty keep risk in play.
🧠 Trade smart, follow the signals, and stay informed.
📌 Don’t miss out! Subscribe to our newsletter for daily crypto updates and actionable market insights.
For crypto veterans and newcomers alike, the current market might feel eerily familiar. Prices are climbing, sentiment is shifting, and charts seem to echo past patterns. If history is any guide, we may be standing on the edge of the most explosive phase of the crypto bull market—a final surge that turns patient positioning into potentially massive returns.
From historical cycles to recent institutional moves, this post breaks down why now may be the time to double down on understanding—and acting on—crypto trends.
Clearer crypto classification (security vs. commodity).
Regulatory sandboxes for innovation.
AML/KYC standards for exchanges.
✅ Why It’s Bullish: Reduced uncertainty = more institutional participation.
6. Law Enforcement & Security: Coinbase Aids $225M Seizure
Coinbase helped the U.S. Secret Service seize $225M in stolen USDT from pig-butchering scams.
🔒 Takeaway: Improved security and compliance make crypto safer for mainstream adoption.
7. Historical Seasonality: Q3–Q4 Bull Runs
Crypto tends to surge in late Q3 and Q4 due to:
Institutional re-entry post-summer.
Retail FOMO during holidays.
Major project launches (e.g., Ethereum upgrades, ETF approvals).
📅 2025 Outlook: If history repeats, October 2025–April 2026 could see the peak.
8. Risks & Warning Signs
Overleveraging: The ETF.jpg file shows a 40X leveraged short position—high risk of liquidation.
Regulatory crackdowns (though unlikely with the GOP framework).
Macro shocks (e.g., geopolitical tensions).
⚠️ Always DYOR (Do Your Research).
Headline
Significance
Trump attacks Powell
Raises political risk around Fed policy
ProCap BTC accumulation
Institutional BTC adoption trend
Morgan Stanley rate cuts
Signals favorable macro conditions for crypto
Coinbase-Law enforcement cooperation
Crypto compliance is strengthening
Senate GOP crypto framework
Regulatory clarity may arrive
GameStop BTC treasury
Corporate Bitcoin use gains momentum
9. FAQs
Q1: What is the final leg of a crypto bull market?
A: The euphoric phase where prices surge parabolically, retail FOMO peaks, and media coverage intensifies.
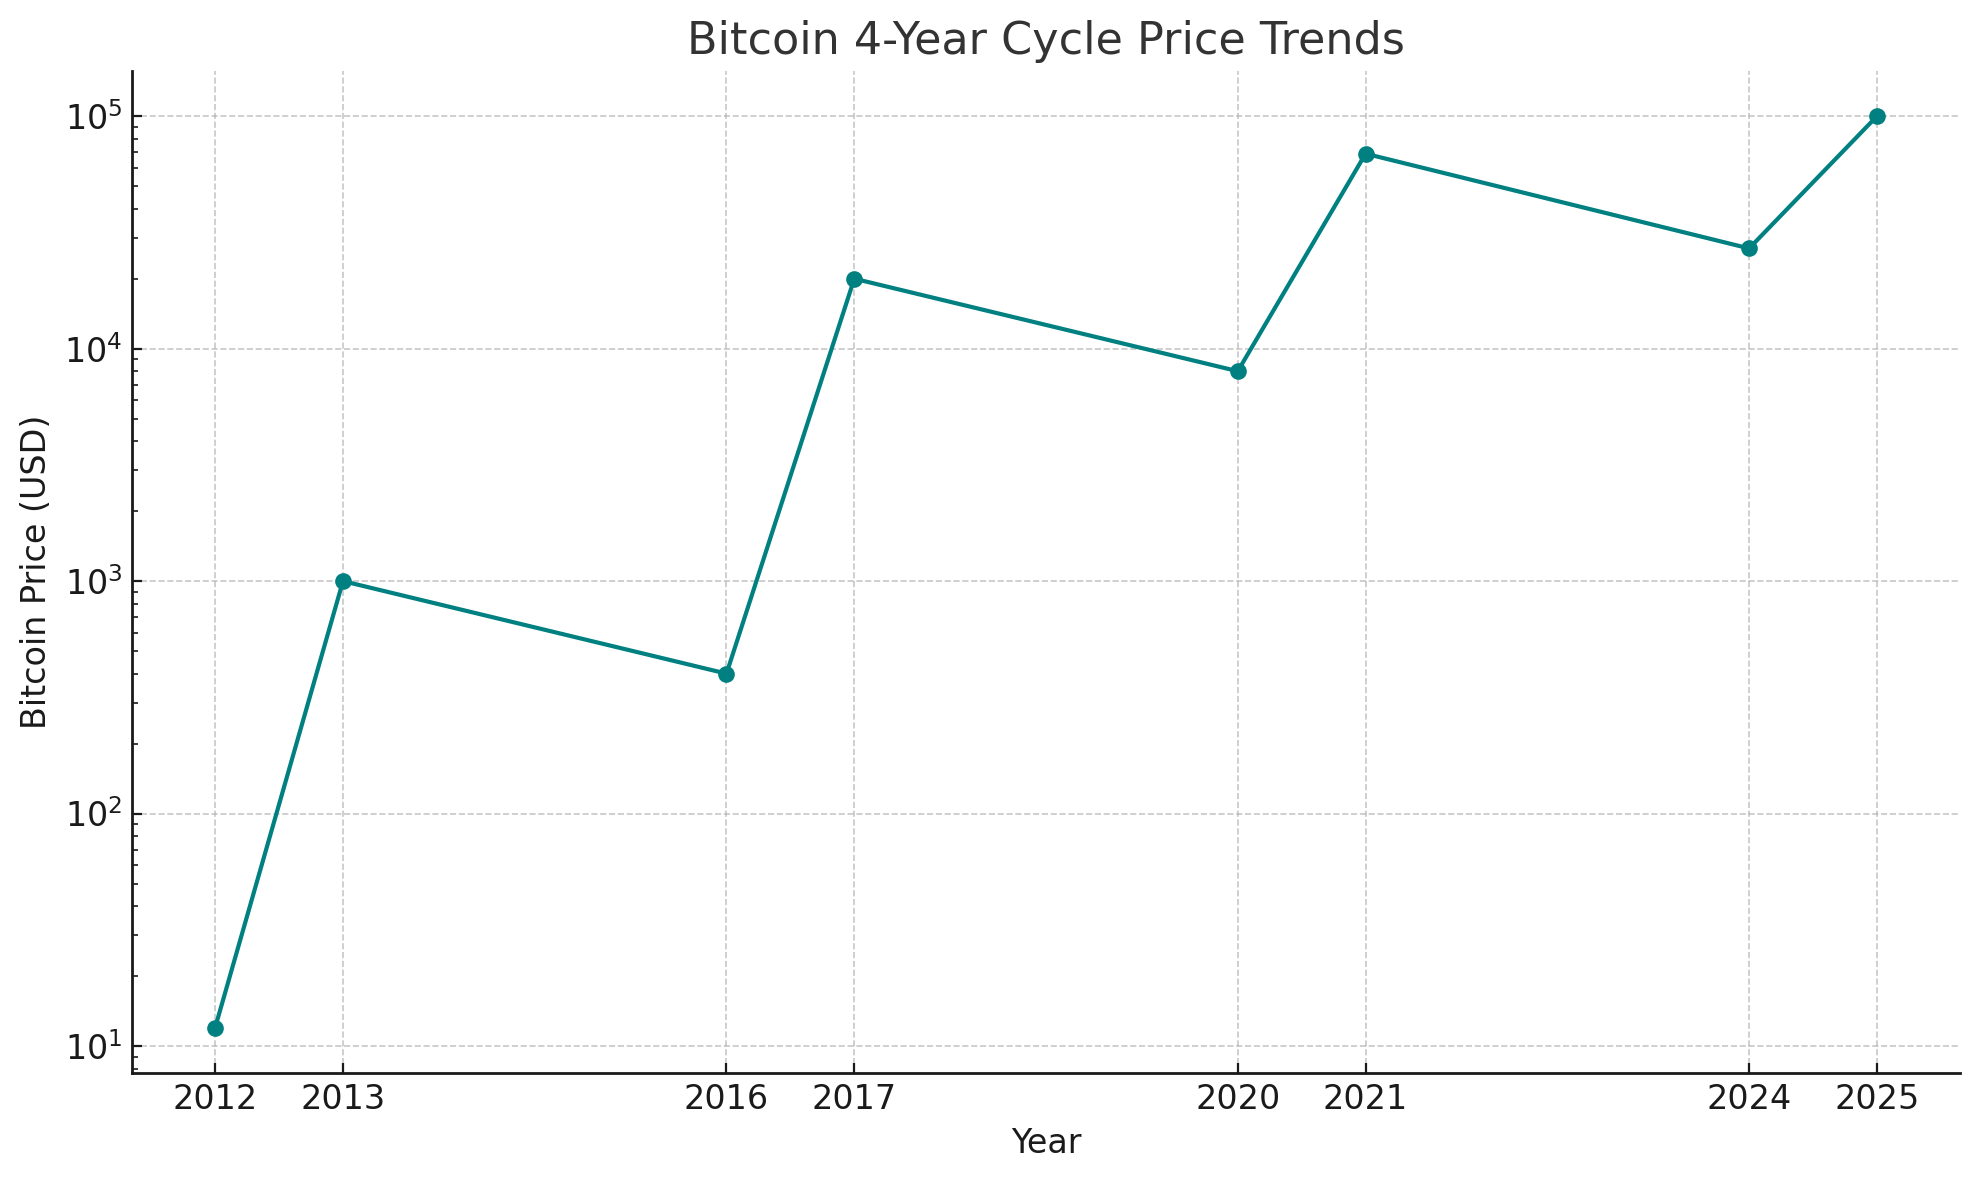
Q2: Is the 4-year Bitcoin cycle still valid?
A: Yes—2024’s post-halving consolidation aligns with past cycles.
Q3: Is it too late to invest in Bitcoin or altcoins?
A: No—analysts believe we’re in the early stages of the final bullish leg.
Q4: What altcoins could outperform?
A: Ethereum, Solana, AI tokens, and low-cap high-utility coins.
Q5: When could the bull market peak?
A: Likely late 2025 to mid-2026, based on historical cycles.
10. Conclusion: Positioning for the Final Surge
The pieces are in place: ✅ Bitcoin Power Curve suggests $250K+ is possible. ✅ Institutions are hoarding BTC. ✅ Fed rate cuts will flood markets with liquidity. ✅ Altcoins are primed for explosive rallies.
Now is the time to:
DCA into Bitcoin & Ethereum.
Research high-potential altcoins.
Avoid overleveraging (like the 40X short in the ETF file).
Stay vigilant for exit signals (extreme greed, blow-off tops).
History doesn’t repeat—but it rhymes. Will you be ready?
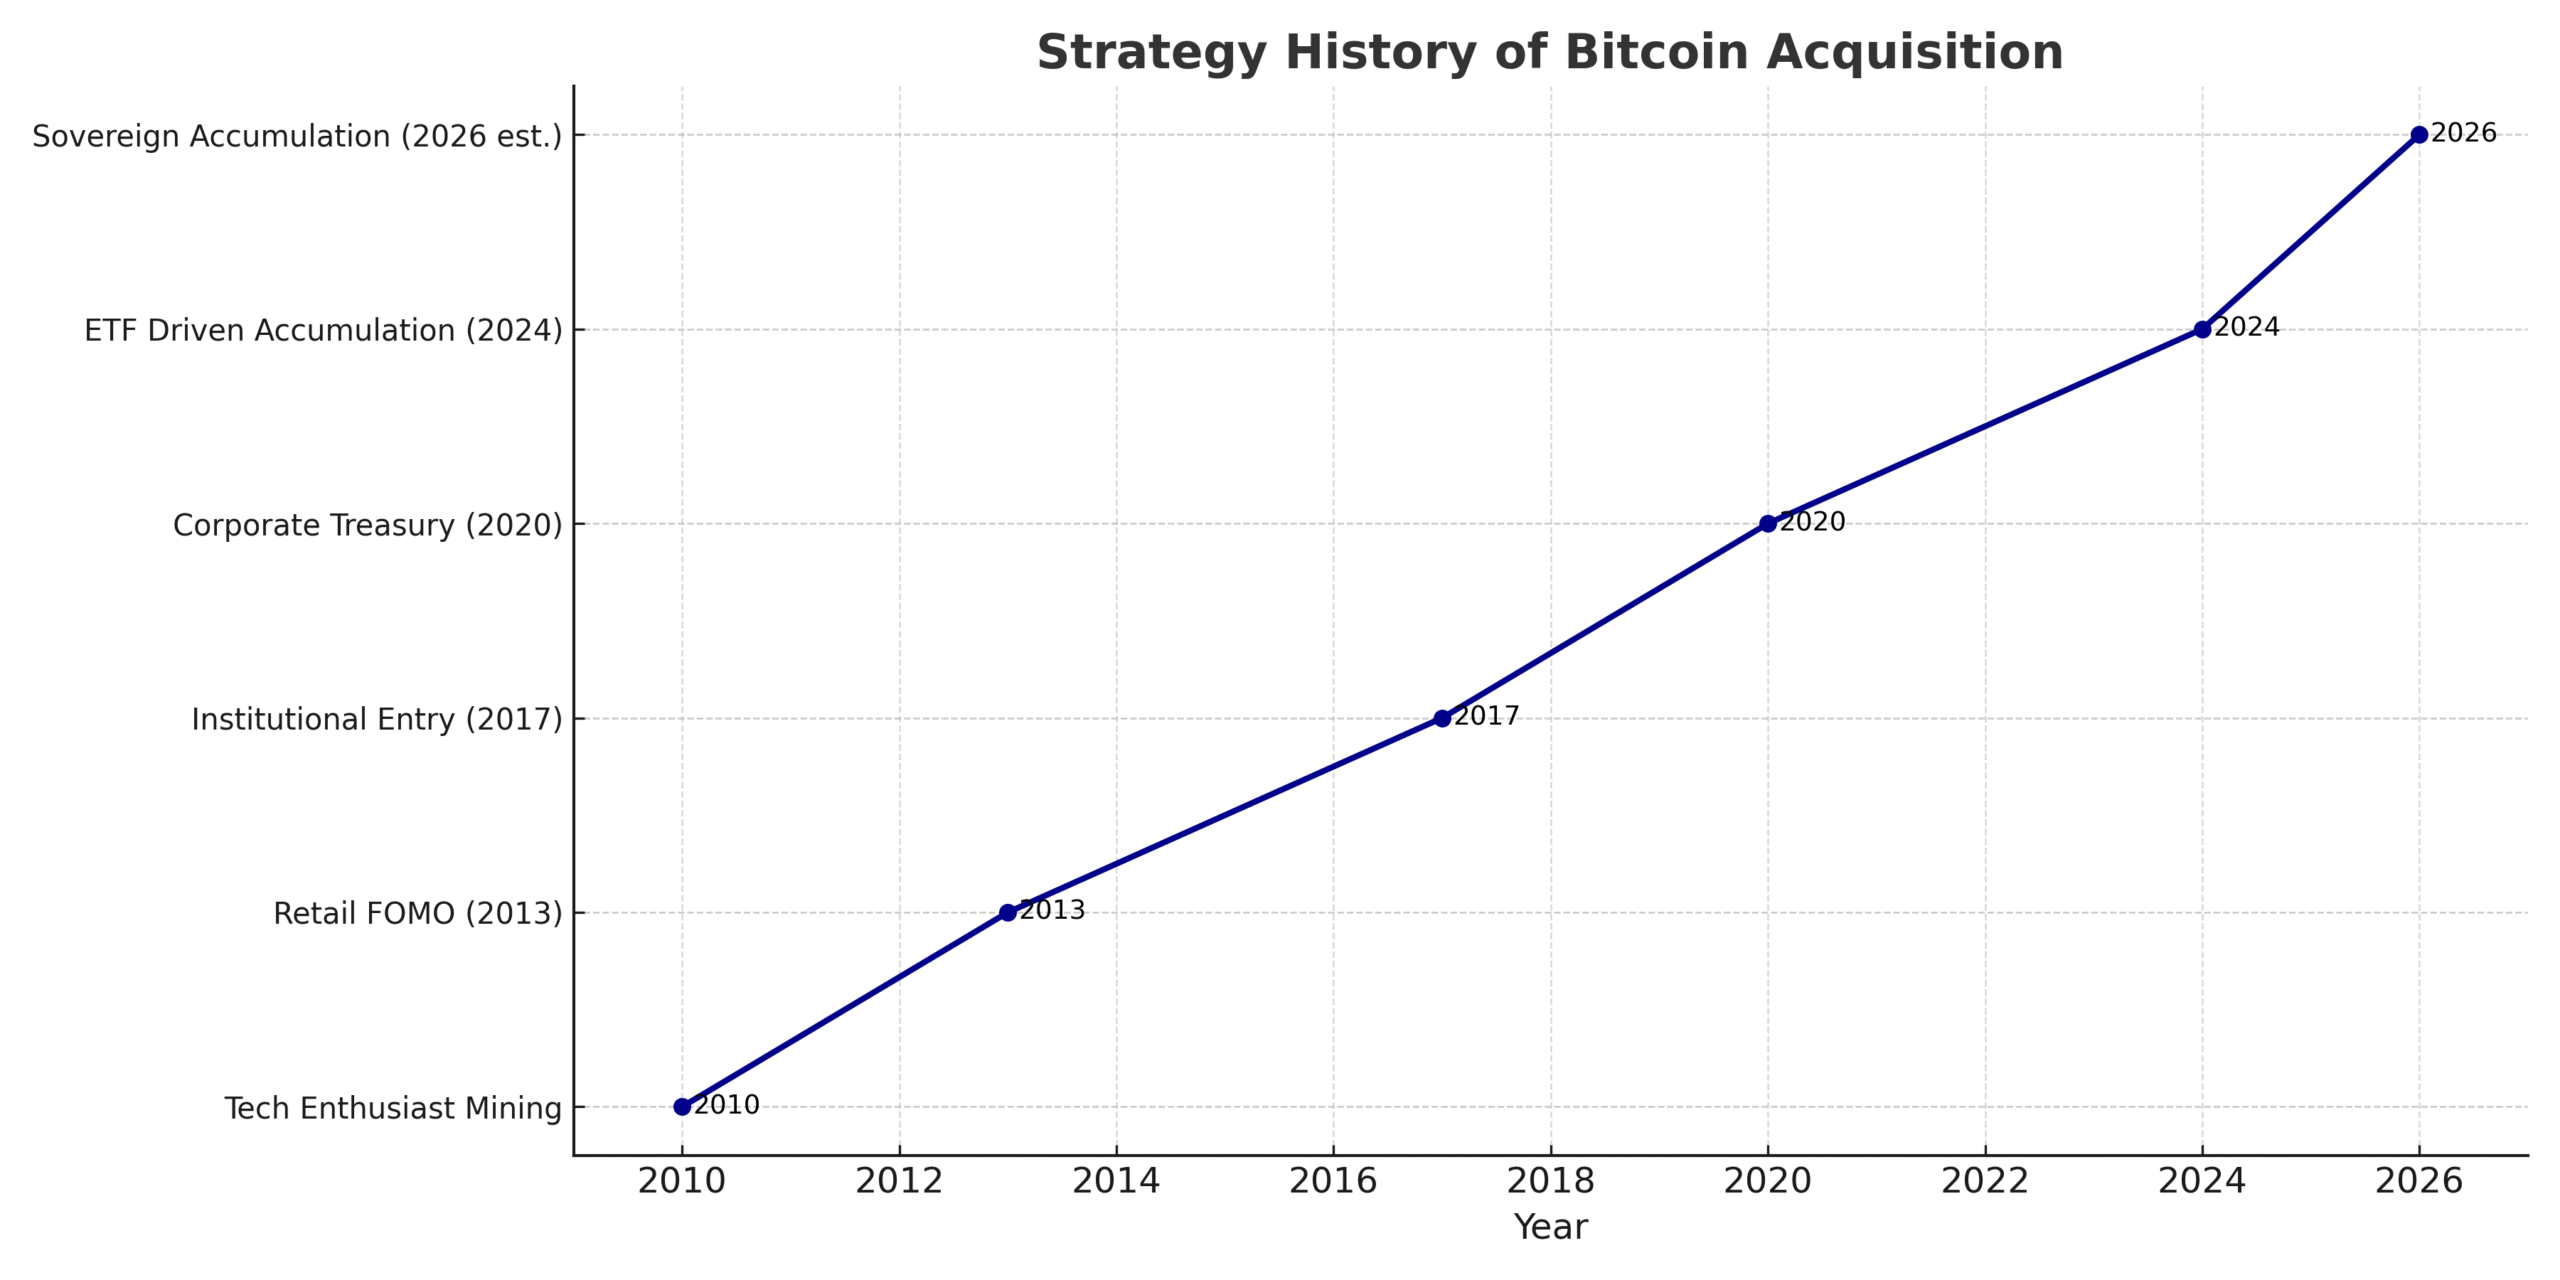
Bitcoin’s price movements have always followed cyclical patterns, but this time, the convergence of institutional adoption, ETF inflows, and sovereign nation accumulation could propel BTC to unprecedented heights—potentially $200,000 or beyond.
In this analysis, I’ll break down Claude AI’s four-phase Bitcoin supercycle, revealing how each stage builds toward a historic bull run. You’ll learn:
The four critical phases of Bitcoin’s growth cycle
How Bitcoin ETFs are creating a supply shock
Institutional and sovereign adoption triggers
Key predictive metrics to track for maximum alpha
The sovereign cascade effect that could accelerate Bitcoin’s rise
By the end, you’ll have a data-driven framework to anticipate Bitcoin’s next parabolic move.
10. Conclusion: Prepare for the Bitcoin Supercycle
Bitcoin’s path to $200K is forming, driven by ETFs, institutions, and sovereign nations. The four-phase supercycle suggests we’re still early in the accumulation stage.
Now is the time to:
Stack Bitcoin before the supply shock worsens.
Monitor key metrics to spot trend reversals.
Prepare for the sovereign cascade that could send BTC parabolic.
Are you ready for the ride?
FAQ Section
1. When will Bitcoin hit $200K?
Based on past cycles, late 2025 is a realistic target if ETF inflows and institutional demand persist.
2. What’s the biggest risk to this prediction?
A prolonged bear market or regulatory crackdown could delay the rally, but the long-term trend remains bullish.
3. How do Bitcoin ETFs affect price?
ETFs buy real Bitcoin, reducing available supply. If demand stays high, prices must rise.
4. Which countries are next to adopt Bitcoin?
Watch Argentina, UAE, and Singapore—they’ve shown the most interest.
5. Should I sell at $200K?
Consider taking profits incrementally, but holding a long-term stash is wise for the next supercycle.
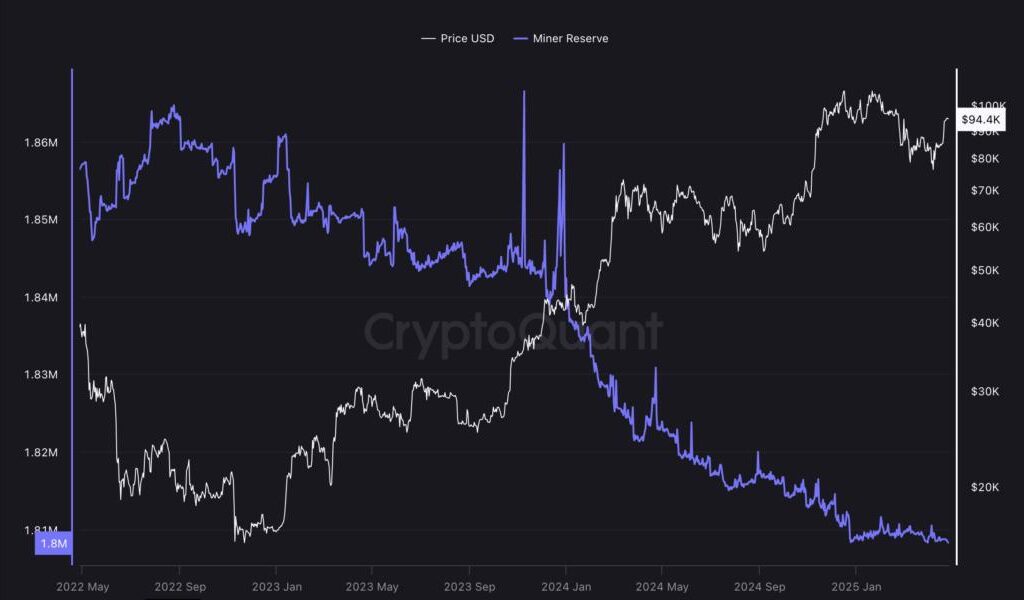
6. What’s the best indicator for Bitcoin’s price?
ETF inflows + exchange reserves are the most reliable short-term signals.
In the wake of the ceasefire between Iran and Israel, global markets rallied, and crypto surged even harder. Bitcoin is now trading above both the 50 EMA and 50 SMA, signaling bullish momentum. Meanwhile, the total crypto market cap sits at the bottom of a rising wedge channel, hovering around $3.2 trillion, closer to a long-awaited breakout. With the 5‑year trendline intact and USDT dominance tipping lower, the stars are aligning for a revived push toward a new all-time high. In this post, you’ll discover:
Why macro factors and technicals support a bullish outlook
How BTC’s 50 EMA/SMA setup favors upside
Altcoin mechanics and the rising wedge story
Three key drivers: global liquidity, Bitcoin technicals, and USDT dominance
Top strategies to prepare before the next leg up
1. BTC Above 50 EMA and 50 SMA—Why It Matters
What the 50 EMA/SMA show: Short‑term and medium‑term trend gauges
Current status: BTC price holds firmly above these moving averages—classic bullish signal
Example: Every historical close above both averages led to subsequent rallies.
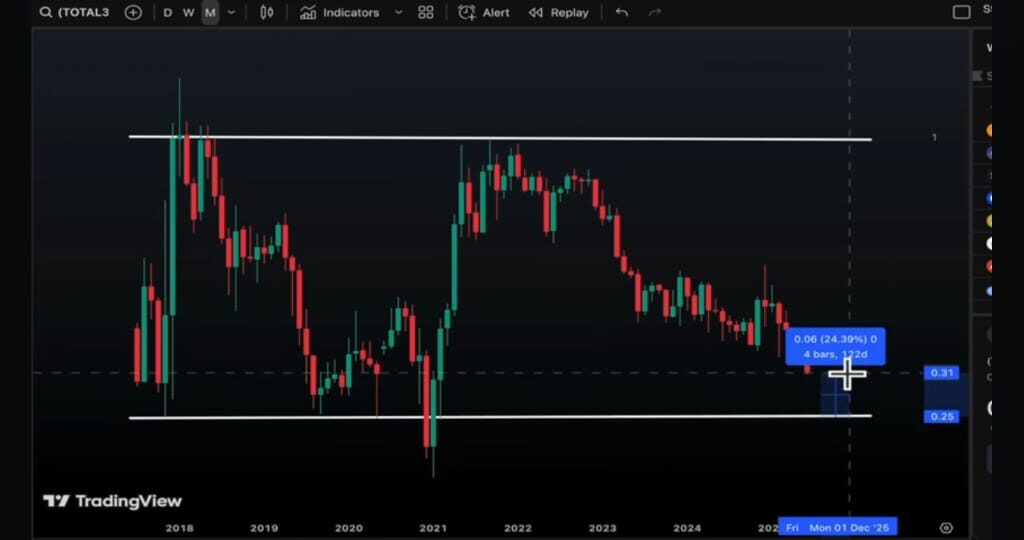
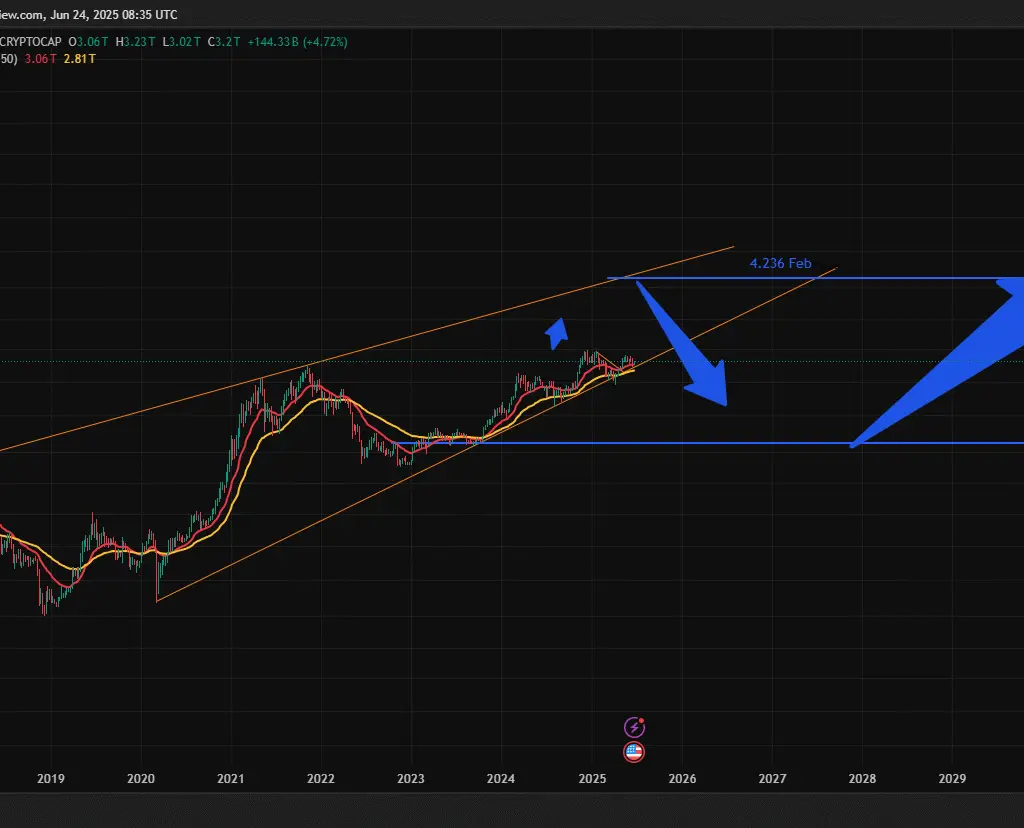
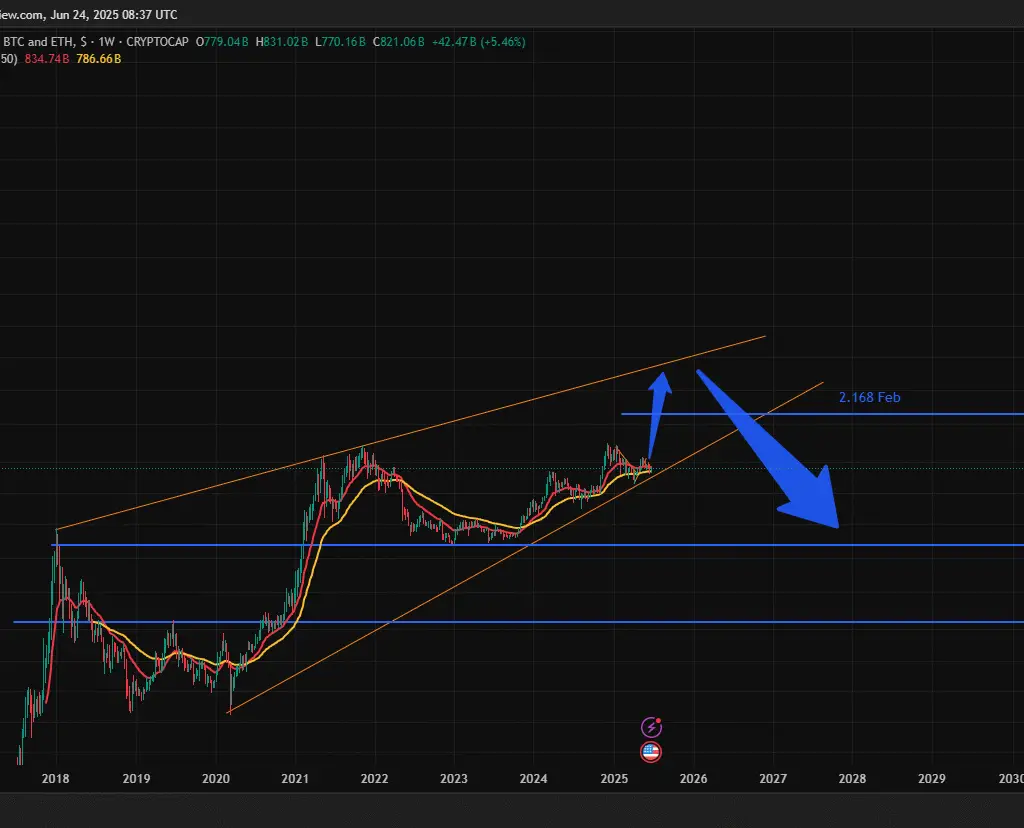
2. Total Crypto Market Cap at Bottom of Rising Wedge
Chart anatomy: Total market cap edged along the bottom trend line ($~3T) of a rising wedge
Support strength: Alongside a 5‑year trendline—dual bullish confluence
Likely move: Edge up toward wedge apex (~$4.3T Feb), then test upper resistance near $10.2T
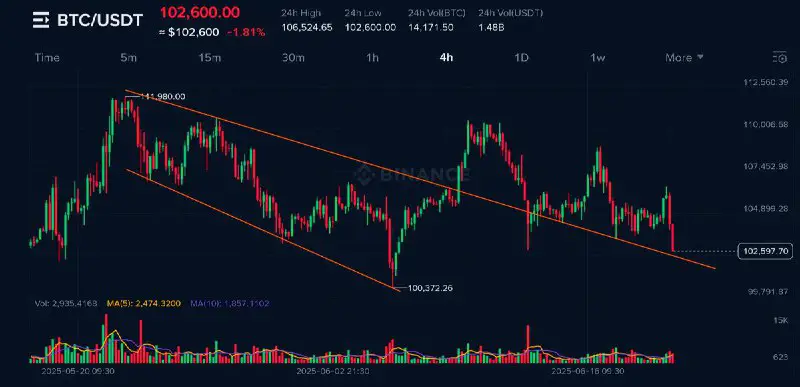
Ceasefire Boosts Crypto: Is This Your Last Chance to Buy BTC and Altcoins?
Rejection at $4.326T could retrace to the wedge base
Global events—regulatory or geopolitical—can shift momentum
USDT dominance spike could instigate short-term pullbacks
10. Actionable Strategies & Tips
Entry: Layer into BTC & Alts near wedge bottom (~$3.0T total cap)
Take‑profit zones: Partial exits around $4.3T and $10T caps
Stop‑losses: Just below the trendline to protect from breakdowns
Position sizing: Risk 1–2% per trade; rebalance after resistance tests
FAQ
Q1: Why does the USDT dominance dropping help crypto? A: It indicates money is exiting stablecoins and entering risk assets like BTC/Alts
Q2: What confirms the rising wedge breakout? A: A weekly close above the upper trendline on significant volume.
Q3: How high can the total market cap go this cycle? A: Best-case rally to ~$10T; mid-target roughly $4.3T.
Q4: When will an altcoin season start? A: After Bitcoin dominance peaks (~66%), and begins to decline.
Q5: Should I hold USDT now? A: Expect USDT.D to decline, so reduce stablecoin exposure gradually.
Q6: What external factors can derail this thesis? A: Regulatory crackdowns, global liquidity contraction, or major global events.
Conclusion & Call to Action
We stand at a pivotal moment in crypto—after the ceasefire, Bitcoin holds above key moving averages, USDT.D drops, and the total market cap is primed for a breakout. With technicals, macro, and capital flows aligning, a move toward new highs is highly probable.
📈 Now is your time to act: Consider buying BTC and key altcoins while risk/reward favors upside. Layer entries, manage stops, and follow volume signals. The next few weeks could rewrite highs—and you don’t want to be left behind.
Next Steps:
Monitor total cap, BTC & alt wedge structures closely
The cryptocurrency market is holding its breath as Bitcoin (BTC/USDT) approaches a make-or-break moment at the $106,780-$106,130 Potential Reversal Zone (PRZ). This level represents a perfect storm of technical factors that could trigger either:
A significant pullback to $103,000 (ideal short opportunity)
A bullish breakout toward $110,000+
Bitcoin at Critical Juncture: PRZ Short Opportunity or Bullish Breakout?
In this comprehensive 2500-word guide, we’ll analyze:
✅ 5 chart patterns converging at the PRZ (with annotated examples) ✅ Elliott Wave count showing why Wave Y may be complete ✅ Liquidation heatmaps revealing where stops cluster ✅ 3 professional trade plans for different scenarios ✅ Exclusive video breakdowns of key concepts
“The market is giving us one of the clearest technical setups we’ve seen in months. This is how smart money prepares for these opportunities.”
Harmonic Patterns Explained:
1. The Anatomy of Bitcoin’s PRZ Setup
1.1 What Makes This Zone Special?
The $106,780-$106,130 zone combines 4 proven reversal signals:
Fibonacci Confluence
0.786 retracement of last swing high
1.272 extension of corrective wave
Harmonic Pattern Completion
Perfect Bearish Gartley pattern (see Chart 1 below)
AB=CD measured move target hit
Institutional Order Blocks
Coinbase Pro order book shows $28M in sell orders
CME futures open interest peaks at $106,500
Psychological Round Number
$107,000 is key mental resistance
Chart 1: BTC 4H Gartley Pattern (Click to enlarge)
2. Elliott Wave Theory: The Final Countdown
2.1 The WXY Correction Explained
Bitcoin appears to have completed a complex WXY corrective structure:
The cryptocurrency markets are known for their crazy price swings, so it is important to know the trend to do a more effective trade. With the market maintaining its dynamic nature, being careful of scams and security threats remains as important as ever — particularly when it comes to Bitcoin (BTC) or any altcoins out there. The number of cryptocurrency hacking and scams targeting users in the crypto space has seen an alarming increase. Selling itself is restricted in areas like India and even if you can get your hands on USDT (Tether), the same scammers now have an easier target.
Protect Yourself: Use a hardware wallet or other secure P2P method. With that said, here is a technical analysis of Bitcoin and three altcoins — Polygon (MATIC), Arbitrum (ARB), and Shiba Inu (SHIB). Disclaimer: This is not financial investment advice always do your research, and trade safe especially as that market can be so volatile.
Bitcoin (BTC) Analysis: Critical Zone.
Bitcoin Analysis and 3 Altcoin Suggestions: A Critical Look at the Market.
Bitcoin is the first cryptocurrency and it controls market patterns. due to much interconnectivity with other currencies,฿ movements (bullish or bear) can dictate via chain_Control action of others. BTC is currently hovering in a crucial region near the $59,000 mark. Bitcoin has struggled with this in the past. The last time that Bitcoin reached this zone, it obtained resistance and then ended up breaking through.
As of now, Bitcoin is back around the same area and its capacity to keep this level will be important for the wellbeing of the increasingly worldwide market. So if BTC holds here at $59,000 we might get a bit of an altcoin relief rally. Meanwhile, Bitcoin has fallen from near its $62,000 peak but continues in the range of $59., 000 and $62. The several green, bullish candles that Bitcoin has printed so far seem to indicate there is no one significant negative piece of news driving the price down and investors should not be concerned in the short term.
Those looking to buy Bitcoin need not look any further than this important level of support. Should Bitcoin hold, we could be in store for some positive price action over the coming days that may indicate a potential recovery throughout the rest of the market.
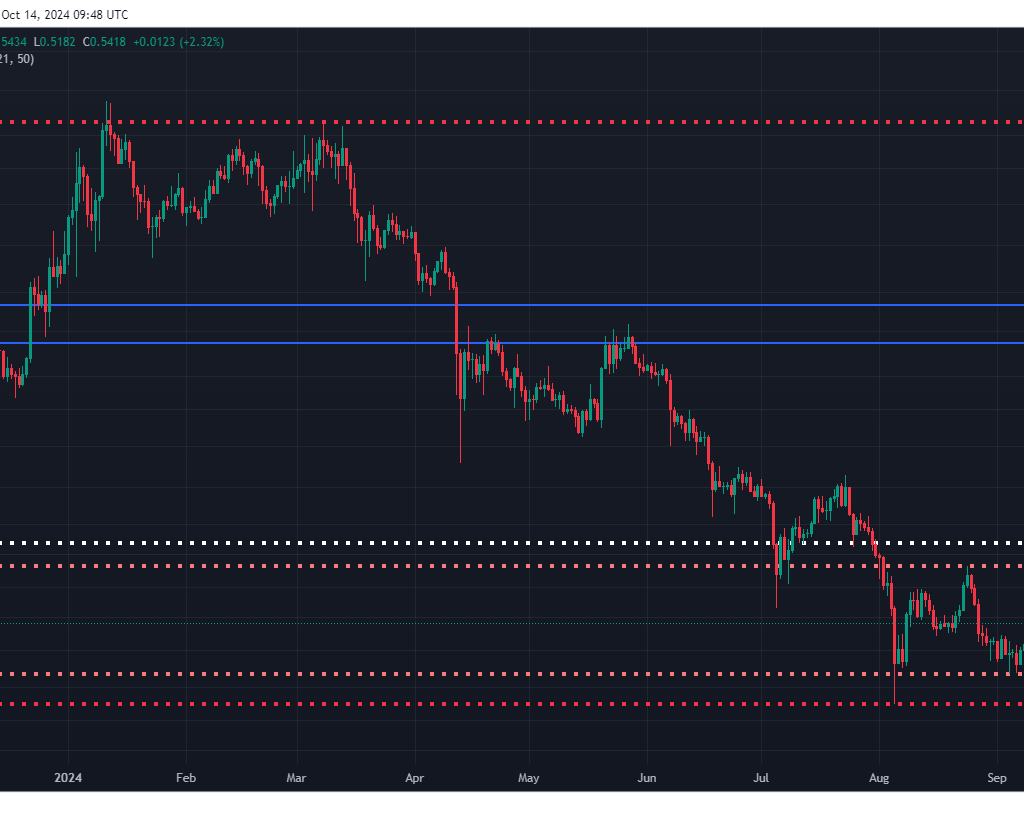
1. Bitcoin (BTC) Support and Resistance Chart
Chart Type: Line or Candlestick Chart
Data Points:
Timeframe: Last 3 months or 6 months
Key Levels:
Support at $59,000
Resistance at $62,000
Highlights, Recent price movements within the $59,000-$62,000 zone, showing green bullish candles and historical struggles at this level.
Analysis: This chart would show how BTC has moved in the key $59,000-$62,000 range, indicating a possible recovery if it holds above $59,000.
Analysis: Polygon (MATIC) in Search of Support
In the following episode, we take a look at Polygon (MATIC) which has been 1 of the underperformers despite the overall market recovery. The downtrend that MATIC has been in has seen the asset consistently setting lows. More recently, the prices took a beating around $0.33 to $0.34 but are now making sluggish moves near the processing platform at somewhere close to $0.ini Despite most other coins showing some strength, MATIC is seemingly dumping.
If we look deeper into the trading volume, it also shows no buying interest which is generally not a good sign as way may be seeing big sell from the Polygon team or some bigger holder. It has been relentless, keeping a lid on kickstarting the coin higher because sufferance is strong enough to see how resilient Bitcoin is.
MATIC Price AnalysisAs long as MATIC continues its decline, going downward a new support price needs to be set up. Before then, it will likely keep heading to new lows while the coin continues its downtrend. On a technical level, the chart is signaling to sell pressure so unless we see an influx of buying power lower MIDTIC price to move on upside.
2. Polygon (MATIC) Price Trend (Lower Lows)
Chart Type: Candlestick or Line Chart
Data Points:
Timeframe: Last 3 months
Key Levels:
Price dropping from $0.33, $0.34, to $0.36
Lack of significant volume to support upward momentum
Trend showing lower lows consistently
Highlight: Downtrend and the absence of support levels, visualizing the continued selling pressure.
Analysis: This chart will emphasize the continuous downtrend, helping readers understand why MATIC hasn’t been able to recover.
Arbitrum (ARB) Chart Analysis, More Room to Bounce!
Arbitrum (ARB) on the other hand has also seen some struggles, specifically fixed up from token unlocks in progress. Token lockups usually bring more supply that could put the price to down if there is not enough demand for these tokens. Several unlock events have occurred for ARB in the past and are anticipated soon.
In the other hand, the main support for ARB starts at $0. A little shortly before this time, ARB rebounded from the same area showing similar upside movement only to see another pullback in price under heavy sales pressure but not before visiting $0.66 at resistance levels which saw profit-taking hit back hard on again and resuming its downside momentum with no concrete retracement zones within the path of frightening prospective buyers who had just started forming their entries.SHARES are now up 238% since then. Here ARB is again approaching that capable support and so is the chance of pouncing back.
On the other hand, ARB is moderate but not so strong in terms of volume. We have no surge in buying at higher prices, so there is nothing that states clearly a sustained recovery as of now. Often the level of interest goes up on a stock as it approaches an important substitution signal, and like for instance ARB has dropped back to test support but investors may be waiting to see if this particular set-up confirms play. However, further dips are possible so trade with caution. One week from now should provide good insight to whether ARB’s chart can turn around or at the very least, continue to grind lower.
Bitcoin Analysis and 3 Altcoin Suggestions: A Critical Look at the Market.
3. Arbitrum (ARB) Support and Bounce Back Prediction
Chart Type: Line or Candlestick Chart
Data Points:
Timeframe: Last 3 months
Key Levels:
Support at $0.44
Resistance at $0.66
Multiple unlock events affecting the price
Highlight: Show past bounces from $0.44 to $0.66 and the expectation for a similar bounce, along with moderate volume indications.
Analysis: This chart will provide a visual for investors waiting to see if ARB can rebound from the $0.44 support zone again.
Related Reading | Shiba Inu (SHIB) Analysis: One More Shot To The Tops?
In recent trading days, all eyes have been on Shiba Inu (SHIB), with many analysts and news outlets suggesting that significant ecosystem improvements are imminent. SHIB has long been classified as a meme coin, but the project took off and succeeded in gaining not only market share but also aligned-side number growth with investors.
SHIB has seen positive trends in the last week and some analysts predict a nearly 1000% pump soon. Of course, one should always take such far-off predictions with a bit of caution, but SHIB has been trending up high
On a more conservative note: we should anticipate up to 30 — 40% price appreciation if the current increase in prices continues. The ecosystem around SHIB continues to develop, and rumors around next-stratospheric gains should be treated with caution but in the short term at least there may be further room for this coin.
Don’t be one of the many investors who held on for dear life in the last bull cycle (us included), watching their gains evaporate before our very eyes. For SHIB, having realistic targets and taking profit at those small levels for now can shield an investor from high risk. It is a good choice to follow the chart of charts closely and make some adjustments in strategies as its price changes are highly speculative.
Bitcoin Analysis and 3 Altcoin Suggestions: A Critical Look at the Market.
4. Shiba Inu (SHIB) Price Pump Potential
Chart Type: Line Chart
Data Points:
Timeframe: Last 2-3 months
Key Movements:
Recent higher highs formation
Predicted pump of 30-40% based on historical trends
Highlight A projection of a potential 30%-40% price increase, with trends showing SHIB’s ecosystem updates.
Analysis: This will showcase SHIB’s price movement along with bullish patterns, indicating a potential short-term price pump.
Conclusion: Caution & Awareness Comes First
While the world of cryptocurrency is rife with opportunity, it does not come without risk. There are scams, hacking, and even market manipulation so always make sure your investments are safe. To secure your crypto from theft, one way is to utilize hardware wallets or other trusted P2P methods for sending/receiving transactions.
The area of $59,000 is one such key region for Bitcoin. BTC If stable may allow for market bounce. But some caution should be taken on altcoins such as MATIC and ARB which are currently under pressure, of course for a token that has the potential to bounce in this case is ALT Community Points same as before. SHIB, however, is one to watch for speculative opportunities – if deployed carefully.
So to sum up: it’s a make-or-break time at the market, days ahead will decide everything. Remain vigilant, stay safe, and keep pivoting in your investment strategy to where the gap is widening.
. Volume Comparison Chart for BTC, MATIC, ARB, and SHIB
Chart Type: Bar or Stacked Area Chart
Data Points:
Timeframe: Last 1 month
Coins: BTC, MATIC, ARB, SHIB
Volume: Daily or weekly trading volumes for all four coins
Highlight: Compare the strength of buying and selling volumes, showing how ARB’s volume is moderate, MATIC’s volume is weak, and SHIB has increased volume.
Analysis: This chart helps readers see which coins have strong market support or are under selling pressure.
FAQs: Bitcoin Analysis and Altcoin Suggestions
1. What is the current support level for Bitcoin (BTC)?
The current support level for Bitcoin (BTC) is around $59,000. If Bitcoin holds this support level, we could see a recovery in both Bitcoin and other altcoins.
2. What should I do if Bitcoin drops below $59,000?
If Bitcoin drops below $59,000, it could indicate further bearish movements. Investors should closely monitor the market and consider waiting for stronger price signals before making major moves.
3. Why is Polygon (MATIC) struggling while other altcoins are recovering?
Polygon (MATIC) is currently experiencing a downtrend, consistently forming lower lows. The trading volume has been low, and there is selling pressure, which has prevented it from making a strong support level.
4. Is MATIC expected to recover soon?
As of now, MATIC is in a downtrend, and unless it forms a support level, it is unlikely to recover quickly. Investors should keep an eye on future developments and wait for a bullish movement before expecting a recovery.
5. What is happening with Arbitrum (ARB) and why is it under pressure?
Arbitrum (ARB) is facing selling pressure due to regular token unlock events, which increase the circulating supply and impact the price. Another token unlock is expected soon, which may affect its price further.
6. Can we expect a price recovery in Arbitrum (ARB)?
Yes, a bounce-back is possible from the $0.44 support level. However, the volume has been moderate, so it’s important to wait and see if the market shows stronger buying interest before confirming a recovery.
7. What are the predictions for Shiba Inu (SHIB)?
Shiba Inu (SHIB) has been showing positive trends, with analysts predicting a potential 30% to 40% price pump in the near term. SHIB’s ecosystem updates and the generally positive trend in meme coins are contributing to this optimism.
8. Can SHIB pump 1000% as some analysts suggest?
While some analysts have suggested the possibility of a 1000% pump, this seems more speculative. A more realistic prediction would be a 30% to 40% increase based on the current market trends and price action.
9. How can I protect myself from cryptocurrency scams?
To protect yourself from cryptocurrency scams, avoid sharing sensitive information, use hardware wallets for storing your crypto, and ensure you’re using reputable peer-to-peer (P2P) methods for transactions. Be cautious of offers that seem too good to be true and always verify the legitimacy of platforms you are using.
10. What are the risks of token unlock events like those happening with ARB?
Token unlock events increase the circulating supply of a cryptocurrency, which can cause downward pressure on the price if there isn’t enough buying demand to absorb the new tokens. Investors should monitor unlock schedules and prepare for potential price volatility.
11. Why is it important to follow Bitcoin’s price movements for altcoin predictions?
Bitcoin often sets the tone for the entire cryptocurrency market. If Bitcoin’s price holds or increases, it usually boosts investor confidence, leading to positive price movements in altcoins as well. Conversely, if Bitcoin drops, altcoins often follow.
12. Should I set smaller targets when trading altcoins like SHIB?
Yes, setting smaller, more realistic targets when trading volatile coins like SHIB is a smart strategy. It helps avoid the mistakes of the last bull run, where many investors held on for too long and missed out on taking profits.
Web 03 refers to the third generation of the internet, which includes technological advancements and changes in web development and user experience. It introduces features such as user-generated content, social media, cloud computing, and mobile applications. Web 03 also focuses on personalization, interconnectivity, and the semantic web.
Web 03, also known as Web 3.0 or the third generation of the internet, encompasses the advancements and changes in web development and user experience. It builds upon the capabilities of Web 2.0 by incorporating features such as user-generated content, social media, cloud computing, and mobile applications.
One of the key aspects of Web 03 is user-generated content. This refers to the ability of users to actively contribute and create content on the internet. Platforms like social media networks, blogging platforms, and community forums allow users to share their thoughts, opinions, and knowledge with others. This has led to a democratization of information and an increase in user engagement and participation.
Social Media.
Another important feature of Web 03 is the integration of social media. Social media platforms like Facebook, Twitter, and Instagram have become an integral part of people’s lives, not only for personal use but also for businesses and organizations. They provide a platform for communication, networking, and collaboration, allowing users to connect and share content easily.
Cloud computing is another significant aspect of Web 03. It enables users to store and access data and applications over the internet rather than relying on their local storage. This provides flexibility and scalability, allowing users to access their information from any device with an internet connection. Cloud computing has revolutionized the way businesses operate and has made it easier to collaborate and share information.
Mobile applications.
Understanding Web 3.0 and its Relationship to the Metaverse.
The rise of mobile applications is also a key characteristic of Web 03.
With the widespread use of smartphones and tablets, there has been a shift towards mobile-centric experiences. Mobile applications offer convenient access to information and services on the go, and they have become an essential part of our daily lives.
Web 03 also focuses on personalization and tailoring content to individual users. The semantic web is an important concept in this regard. The semantic web aims to make the content on the internet more understandable by both humans and machines. It focuses on organizing information in a way that allows computers to understand the meaning of data and provide more relevant search results, recommendations, and personalized experiences.
Investment in web3.
Investing in Web3 involves understanding the technology and the various opportunities it presents. Here are some general steps and considerations to keep in mind when investing in Web3:
Educate yourself: Start by learning about the fundamentals of Web3. Understand blockchain technology, decentralized finance (DeFi), non-fungible tokens (NFTs), and other aspects of the Web3 ecosystem. This will assist you in making educated venture choices.
Research projects and tokens: There are numerous Web3 projects and tokens available for investment. Look into their whitepapers, team backgrounds, and community support. Evaluate their potential for growth and adoption in the Web3 space.
Diversify your investments: Just like any other investment, it’s important to diversify your portfolio. Invest in a range of Web3 projects and tokens to spread out your risk. This can include investing in established cryptocurrencies like Bitcoin and Ethereum, as well as promising new projects.
Stay updated with trends and news: The Web3 space is evolving rapidly. Follow reputable sources of information to stay updated with trends, news, and regulatory developments. This will assist you in making educated venture choices and dodge potential pitfalls.
Consider risks and volatility: Web3 investments can be highly volatile. Be arranged for cost changes and potential misfortunes. It’s important only to invest what you can afford to lose and to conduct thorough research before making any investment decisions.
Seek professional advice if needed: If you’re new to investing or are unsure about certain aspects of Web3, consider seeking advice from professionals or financial advisors specializing in cryptocurrencies and blockchain technology.
Understanding Web 3.0 and its Relationship to the Metaverse.
Remember, investing in Web3 carries risks, and it’s important to do your due diligence and invest responsibly.
Web3 in Crypto.
Web3 in crypto refers to the third generation of blockchain technology and decentralized applications (dApps). It represents the evolution of the crypto space beyond just cryptocurrencies like Bitcoin and Ethereum. Web3 aims to build a decentralized internet where individuals have more control over their data and interactions.
Web3 incorporates various technologies, such as blockchain, smart contracts, and decentralized storage, to enable peer-to-peer interactions without the need for intermediaries. It aims to create a more transparent, secure, and efficient ecosystem for online transactions, data storage, and application development.
With Web3, users have more ownership and control over their digital assets. They can participate in decentralized finance (DeFi) platforms, where they can lend, borrow, or earn interest on their digital assets without relying on traditional banks or financial institutions. They can also engage in decentralized exchanges (DEXs) to trade cryptocurrencies directly with others, eliminating the need for centralized exchanges.
One of the key aspects of Web3 is the concept of self-sovereign identity, where individuals have control over their data and can choose how and when to share it. This addresses privacy concerns associated with centralized platforms that collect and monetize user data.
Web3 also enables the creation and use of non-fungible tokens (NFTs). NFTs represent unique digital assets that can be bought, sold, and traded on blockchain platforms. They have gained popularity in digital art, gaming, and collectibles, allowing creators to monetize their work and provide verifiable ownership.
Overall, Web3 in crypto represents a shift towards a more decentralized, transparent, and user-centric internet. It offers new opportunities for individuals to participate in various decentralized applications, access financial services without intermediaries, and have more control over their digital lives.
Web3 blockchain.
Understanding Web 3.0 and its Relationship to the Metaverse.
Web3 blockchain refers to the use of blockchain technology in the Web3 ecosystem. Blockchain is a decentralized and distributed ledger that allows for the secure and transparent recording of transactions. In Web3, blockchain technology is utilized to enable peer-to-peer interactions, eliminate the need for intermediaries, and ensure the integrity and immutability of data.
Web3 blockchain often incorporates smart contracts, which are self-executing contracts with the terms of the agreement directly written into code. Smart contracts enable automated and trustless transactions, as they automatically execute predefined conditions once they are met. These smart contracts are typically deployed on blockchain networks, such as Ethereum or Polkadot, and are accessible to users within the Web3 ecosystem.
By leveraging blockchain technology, Web3 blockchain offers various advantages. It allows for increased security, as data is stored and verified across multiple nodes, making it highly resistant to tampering or unauthorized changes. It also enhances transparency, as all transactions are recorded on the blockchain and can be verified by anyone. This transparency fosters trust and accountability within the Web3 ecosystem.
Web3 blockchain also enables the creation and use of decentralized applications (dApps). These dApps run on blockchain networks and utilize smart contracts to provide services and functionalities without relying on centralized servers or intermediaries. This decentralization ensures users have more control over their data and digital interactions.
Overall, Web3 blockchain combines the principles of blockchain technology with the advancements of the Web3 ecosystem to create a more decentralized, transparent, and secure internet infrastructure.
Web 3.0 and its examples.
Web 3.0, also known as the decentralized web or the semantic web, refers to the next generation of the internet that aims to provide a more user-centric and decentralized experience. It involves the integration of blockchain technology, artificial intelligence, the Internet of Things (IoT), and other emerging technologies to create a more transparent, secure, and efficient online ecosystem.
Examples of Web 3.0 technologies and applications.
Blockchain-based platforms: Platforms like Ethereum, Polkadot, and Cardano enable the development and deployment of decentralized applications (dApps) and smart contracts. These platforms provide the infrastructure for various Web 3.0 services and functionalities.
Decentralized finance (DeFi): DeFi platforms leverage blockchain technology to offer traditional financial services in a decentralized manner. They enable users to lend, borrow, trade, and earn interest on cryptocurrencies without relying on traditional financial intermediaries.
Non-fungible tokens (NFTs): NFTs are unique digital assets that can represent ownership or proof of authenticity for digital content, such as artwork, music, or collectibles. NFTs have gained popularity in the art and gaming industry, enabling creators to monetize their work and provide verifiable ownership.
Decentralized social media: Projects like Steemit and Minds aim to create social media platforms that prioritize user privacy, data ownership, and content monetization. They utilize blockchain technology to create decentralized and censorship-resistant social networks.
Internet of Things (IoT): Web 3.0 incorporates IoT devices and sensors to create a more interconnected online ecosystem. These devices can interact autonomously, exchanging data and executing smart contracts without the need for centralized control.
Data ownership and privacy: Web 3.0 aims to address data privacy concerns by giving users more control over their data. Projects like Solid, developed by Sir Tim Berners-Lee, enable individuals to store and manage their data in a secure and decentralized way.
These are just a few examples of the emerging technologies and applications that fall under the Web 3.0 umbrella. The ultimate goal of Web 3.0 is to empower individuals, enhance privacy and security, and create a more user-centric and decentralized Internet.
Web 3.0 introduced?
The concept of Web 3.0 was introduced in the early 2000s, but there is no widely accepted consensus on the exact date or event that marks its introduction. The term “Web 3.0” was coined by John Markoff of The United York Times in 2006 to portray the following stage of the web, which would be characterized by greater interconnectivity, personalization, and intelligence. Since then, the idea of Web 3.0 has evolved and encompassed various technologies and concepts, including blockchain, decentralized applications, and user-centric experiences.
Understanding Web 3.0 and its Relationship to the Metaverse.
Web 3.0 refers to the next generation of the internet that aims to provide a more user-centric and decentralized experience. It involves the integration of blockchain technology, artificial intelligence, the Internet of Things (IoT), and other emerging technologies to create a more transparent, secure, and efficient online ecosystem. Web 3.0 focuses on empowering individuals, enhancing privacy and security, and creating a more decentralized and personalized Internet.
On the other hand, the metaverse is a concept that describes a virtual reality space where users can interact with a computer-generated environment and other users in real time. It is often described as a collective virtual shared space that is created by the convergence of physical and digital realities. The metaverse aims to provide immersive and interactive experiences that go beyond traditional internet interactions.
While Web 3.0 is more focused on improving the underlying infrastructure and technologies of the internet, the metaverse is focused on creating virtual environments for users to explore and interact with. Web 3.0 technologies and platforms may serve as the foundation for building and accessing the metaverse, but the metaverse itself is a specific use case or application of Web 3.0 principles.
Web3 developer.
A Web3 developer is a professional who specializes in developing applications and platforms that utilize Web 3.0 technologies. These technologies include blockchain, decentralized protocols, smart contracts, and distributed systems. Web3 developers typically have a strong understanding of programming languages such as Solidity (for Ethereum-based projects), JavaScript, and other relevant languages for developing decentralized applications (dApps) and services. They work on building the infrastructure, protocols, and user interfaces that enable decentralized and user-centric experiences on the Internet.
Conclusion.
In conclusion, Web 03 represents a significant leap in the evolution of the internet. It incorporates user-generated content, social media, cloud computing, and mobile applications to enhance the overall web experience. Personalization and the semantic web play important roles in tailoring content and improving search results and recommendations.
FAQs.
What is Web 3.0?
Web 3.0, also known as the decentralized web or semantic web, represents the next generation of the internet that focuses on decentralization, user-centric experiences, and the integration of emerging technologies like blockchain and artificial intelligence.
What are the key features of Web 3.0?
Key features include decentralization, user-generated content, social media integration, cloud computing, mobile applications, personalization, and the semantic web for improved data understanding.
How does Web 3.0 differ from Web 2.0?
Web 3.0 builds upon the capabilities of Web 2.0 by incorporating decentralized technologies, enhancing user control over data, and introducing concepts like blockchain, smart contracts, and the Internet of Things (IoT).
What is the role of blockchain in Web 3.0?
Blockchain plays a crucial role in Web 3.0 by providing a decentralized and secure ledger for transactions, enabling smart contracts, and fostering trust through transparent and tamper-resistant data storage.
What are some examples of Web 3.0 technologies and applications?
Examples include blockchain-based platforms (Ethereum, Polkadot), decentralized finance (DeFi), non-fungible tokens (NFTs), decentralized social media, and projects focused on data ownership and privacy.
When was Web 3.0 introduced?
The term “Web 3.0” was coined by John Markoff in 2006, but the concept and development of Web 3.0 technologies have evolved.
How does Web 3.0 relate to the metaverse?
While Web 3.0 focuses on the underlying infrastructure of the internet, the metaverse is a virtual reality space. Web 3.0 technologies may serve as the foundation for building and accessing the metaverse.
What is a Web3 developer?
A Web3 developer is a professional specializing in developing applications and platforms using Web 3.0 technologies. They often work with blockchain, smart contracts, and decentralized systems, and are proficient in relevant programming languages such as Solidity and JavaScript.
How can I invest in Web3?
Investing in Web3 involves educating yourself on blockchain technology, researching projects and tokens, diversifying your investments, staying updated with trends, considering risks and volatility, and seeking professional advice if needed.
What are the risks associated with Web3 investments?
Web3 investments can be highly volatile. It’s important to be prepared for price fluctuations, and potential losses, and to invest only what you can afford to lose. Thorough research and staying informed are crucial for responsible investment in the Web3 space.
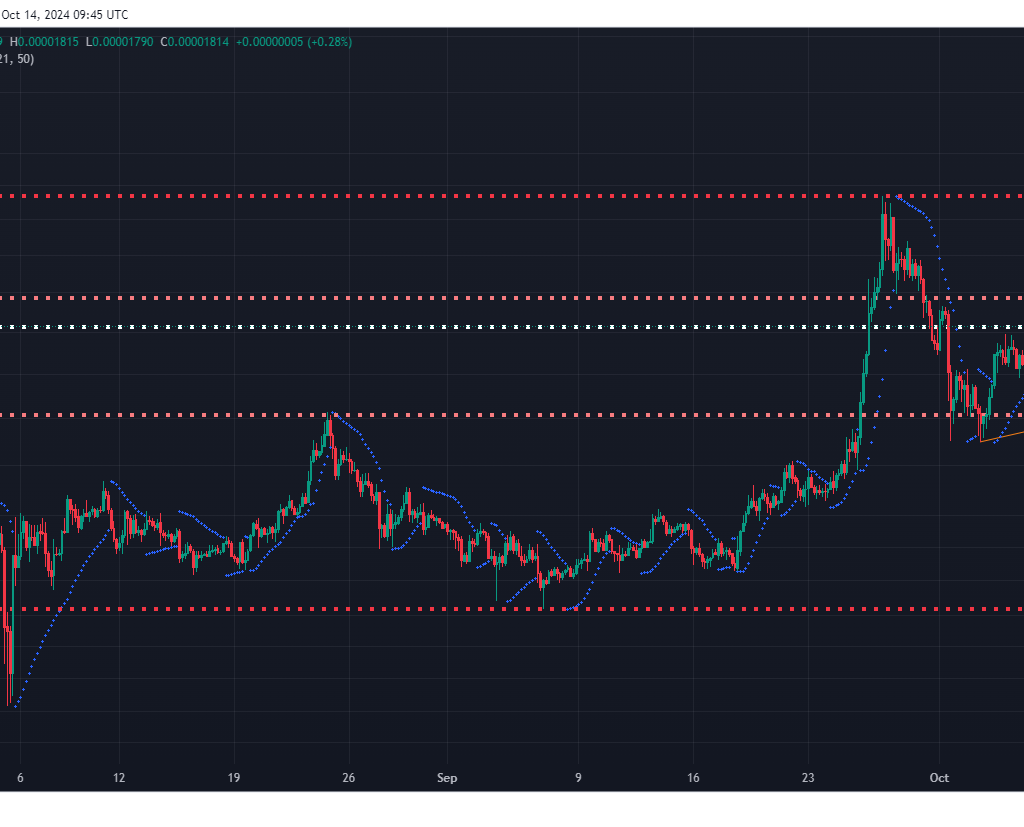
Cryptocurrency enthusiasts and traders have been on the edge of their seats as Bitcoin, the leading digital currency, recently experienced a significant surge in its price, breaking the $37,000 mark. This sudden price pump has garnered attention, but what’s next for Bitcoin? In this article, we’ll delve into the details of Bitcoin’s recent performance, the formation of a double-top pattern, and strategies for investors in these volatile times.
Understanding Bitcoin’s Trendline.
Trendlines play a crucial role in the technical analysis of cryptocurrencies, providing insights into potential price movements. Bitcoin has shown a remarkable tendency to respect its trendline, making it a valuable indicator for traders.
Price Pump and Breakthrough: $37,000 Mark
The later surge in Bitcoin’s cost, outperforming the $37,000 check, has cleared out numerous of the driving powers behind this quick increment. Analyzing the components contributing to this breakthrough can give important bits of knowledge for both prepared and amateur dealers.
Double Top Pattern: A Bearish Signal
Amidst the excitement of the price pump, a cautious eye must be cast on the formation of a double-top pattern. This bearish signal, if confirmed, could signal a potential downturn in Bitcoin’s price.
Identifying Support Levels
To comprehend the potential impact of the double-top pattern, it’s essential to identify key support levels. The $36,000 support level is a critical point to watch, as a breakdown could trigger a cascade effect on Bitcoin’s price.
Investors are closely monitoring the charts as Bitcoin hovers near the $35,400 threshold. A drop below this level could have significant implications for the market, prompting a reevaluation of trading strategies.
Buying Opportunities: Store/USDT.
Amidst market fluctuations, opportunities for strategic buying arise. The Store/USDT strategy presents an avenue for investors to capitalize on potential market movements. Understanding the intricacies of this strategy is crucial for those seeking to optimize their investment portfolios.
Entry Points and Target Expectations
For investors looking to enter the market, pinpointing entry points is paramount. The article suggests a specific range (0.018360 to 0.017752) and sets realistic target expectations of 10% to 15%, with TP1 at 0.020000 and TP2 at 0.021443.
Stop-loss strategy
While the profit potential is enticing, responsible trading requires a robust stop-loss strategy. Monitoring daily candle closures and implementing a stop loss below 0.017892 can help mitigate potential losses.
Conclusion
In conclusion, Bitcoin’s recent surge and the formation of a double-top pattern present both opportunities and risks for investors. Understanding market signals, identifying support levels, and employing effective strategies are crucial in navigating the current cryptocurrency landscape.
Frequently Asked Questions (FAQs).
FAQ 1: How often do double-top patterns result in price drops?
Double-top patterns are considered bearish signals and often precede price drops. However, their reliability depends on various market factors, and confirmation is crucial before making trading decisions.
FAQ 2: Why is the $37,000 mark significant for Bitcoin traders?
The $37,000 mark is a psychological and technical resistance level. Breaking through this point can indicate bullish momentum, but traders should also be cautious of potential reversals.
FAQ 3: What factors contribute to the support level near $36,000?
Support levels are influenced by market sentiment, historical price data, and investor behavior. A combination of these factors contributes to the establishment of key support levels.
FAQ 4: How can investors effectively utilize the Store/USDT strategy?
Investors can use the Store/USDT strategy by carefully timing their entry points within the suggested range and setting realistic target expectations. Diligent monitoring of market conditions is essential.
FAQ 5: Why is monitoring daily candle closure crucial in cryptocurrency trading?
Monitoring daily candle closures provides insights into market trends and helps traders make informed decisions. It is a crucial aspect of technical analysis to gauge the strength and sustainability of price movements.
Bitcoin’s recent candle closure and the significance of a bullish trend. Current Bitcoin Accumulation Analyzing Bitcoin’s current standing at nearly $37,000. Crucial Resistance: The $38,000 Mark Significance of breaking the $38,000 obstruction for bullish energy. Potential Outcome: Price Projection near $40,000 Exploring the potential outcomes after breaking the resistance. Identifying Support Levels: The $36,500 Zone Understanding the critical support zone and its impact. Bitcoin’s Journey: Analyzing Recent Trends Bitcoin’s market performance has left enthusiasts and investors intrigued with its recent developments. The closure of the weekly candle in a bullish shade has piqued the interest of the crypto community. But what does this mean for the world’s leading cryptocurrency?
The Recent Candle Closure:
Within the world of Bitcoin, the closing of the week-after-week candle regularly serves as a typical representation of its prompt direction. This recent closure surfaced in a green hue, a signal eagerly anticipated by many in the crypto realm. The green candle is a potential sign of an upward trend in the making.
Currently, Bitcoin is in an accumulation phase, hovering close to the $37,000 mark. This stage has captivated both financial specialists and investigators, clearing them balanced for another major move.
The Hurdle: Breaking the $38,000 Mark
To gain substantial bullish momentum, Bitcoin needs to break the significant resistance at $38,000. This particular threshold marks a pivotal point in determining the cryptocurrency’s near-future direction.
A Breakout: Potential Journey to $40,000
Should Bitcoin surpass this resistance, experts speculate a potential surge that could see the price edging closer to the $40,000 mark. This projection has aroused both excitement and anticipation among investors.
Essential Support: The $36,500
However, while the anticipation of an upward trend persists, it’s essential to recognize the significance of support levels. The $36,500 zone stands as a crucial support level, signifying the price’s potential resilience if faced with a downturn.
In the volatile landscape of cryptocurrency, it’s essential to balance the optimism surrounding potential upswings with the pragmatic acknowledgment of support levels. Understanding these intricacies ensures a more informed and cautious approach to investing in Bitcoin.
Conclusion.
Bitcoin’s recent candle closure, accumulation of around $37,000, and critical resistance at $38,000 highlight the intricate dynamics of its market behavior. These factors, coupled with the potential price projection and identified support levels, paint a multifaceted picture for investors to consider.
The crypto world remains ever-changing, and staying informed about these crucial markers becomes paramount in making sound investment decisions.
FAQs
Is Bitcoin’s price expected to rise significantly shortly? Bitcoin’s potential surge to $40,000 is startling on breaking the $38,000 resistance; be that because it may, promote changes that affect such projections.
How crucial are support levels like the $36,500 zone? Support levels are pivotal as they indicate potential stability in case of price downturns.
Why is the $38,000 stamp critical for Bitcoin? Breaking this resistance level can potentially initiate a bullish trend in Bitcoin’s price.
What does a green weekly candle signify for Bitcoin? A green candle often symbolizes a bullish trend, hinting at a potential price rise.
How should investors approach Bitcoin’s current market situation? Keeping a balance between optimism and caution is advisable. Understanding both resistance and support levels can offer assistance in making taught choices.
The cryptocurrency market remains a hotbed of activity, with Bitcoin’s price keeping traders on the edge of their seats. In recent developments, Bitcoin managed to maintain its stability above the crucial $34,000 support zone. Bulls attempted to stage a comeback, pushing Bitcoin’s price above the $35,250 resistance, marking an exciting turn of events. Moreover, a significant transfer of $350 million worth of 36 assets by FTX and Alameda Research to exchanges raises questions about the market’s future trajectory. In this blog post, we will delve into the recent price action of Bitcoin and the implications of this substantial asset transfer.
Bitcoin Price Holds Steady.
Over the past week, Bitcoin has demonstrated remarkable resilience as it holds its ground above the $34,000 support zone. This stability is a promising sign, indicating that the cryptocurrency is not succumbing to bearish pressure easily. Investors and traders have been keenly observing this critical level, as a breach below it could have triggered a more significant sell-off.
Bulls Make Their Move.
One of the most exciting developments in recent days is the bullish attempt to break above the $35,250 resistance zone. This is a significant milestone for Bitcoin, as it marks an effort by the bulls to regain control of the market. Intraday trading charts reveal that there was a break above a major contracting triangle, with resistance near $35,000. This breakout signaled the potential for an upward movement in the Bitcoin price.
Key Resistance Levels Breached.
Bitcoin Price Analysis, Bulls Attempt to Break Resistance.
Bitcoin’s ascent did not stop at $35,250. The cryptocurrency continued its climb, successfully clearing the $35,500 resistance level. This is an encouraging sign for bullish traders who have been waiting for an opportunity to regain control of the market. However, the bears have not given up easily and have shown activity near the $36,000 zone, indicating that a battle is ongoing at this critical level.
$350M Transfer Raises Eyebrows.
In a sudden and significant move, FTX and Alameda Research transferred a whopping $350 million worth of 36 different assets to various exchanges. This unexpected development has captured the attention of the cryptocurrency community and raised questions about the motivations behind such a massive transfer. Among the assets transferred are notable cryptocurrencies like Solana ($SOL), Enjin Coin ($ENS), and Groestlcoin ($GMT), along with several others.
Conclusion and Market Speculation:
As Bitcoin remains in a battle for dominance in the cryptocurrency market, the recent price actions and the substantial asset transfer have left traders and investors speculating about what the future holds. The stability above the $34,000 support and the bullish attempts to breach resistance levels are signs that the market is far from being settled.
The $350 million asset transfer to exchanges adds another layer of complexity to the equation. While it could signify a desire to cash in on profits or reallocate assets, it also raises questions about market sentiment and potential impending movements. Traders should stay vigilant, keeping a close eye on the Bitcoin price charts and monitoring any further developments in the market.
In conclusion, Bitcoin’s price action and the large asset transfer indicate that the cryptocurrency market is in a state of flux. We must stay informed, proceed with prudence, and be ready for a variety of situations in this dynamic and always-changing market going forward. The cryptocurrency community is eagerly awaiting the next chapters of this tale, which have not yet been written.